Given the correct conditions, it becomes possible to measure flow with only water level measurements. Typically this is done using a weir but can also be accomplished by profiling a stream at different times and in different conditions.
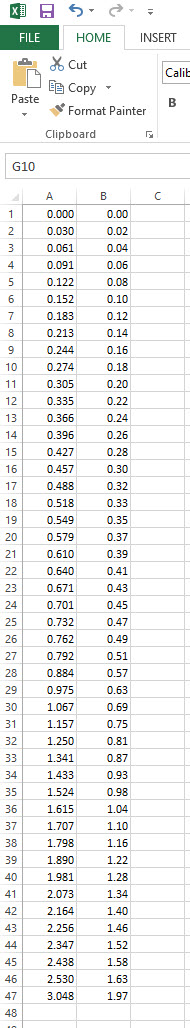
In order for level only flow measurements to work, an application specific rating curve must be generated by the user. This table consists of two columns: depth and flow rate. For the purposes of WQData LIVE uploading, the table must be formatted as a .csv file with the first column representing depth in meters and the second column being flow rate in meters/second. There should be no table headers.
An example table is available here for review and is shown below as both the raw text file and a formatted Excel document. Typically tables have between 20 and 70 entries. If the measured level falls between entered points, a linear approximation between adjacent points is used to determine the flow rate at that level.